Why Most Marketing Teams Have No Idea How Their Creative Stacks Up
Finance teams benchmark everything. Product teams track NPS against category averages. Sales teams know their win rates relative to competitors. But when it comes to creative — the ads, the campaigns, the messaging that drives brand growth — most marketing teams are operating without any external reference point at all.
This is a strange gap. Creative is often the single largest variable in campaign performance. The difference between a strong ad and a weak one can be a 2–5x swing in brand lift and purchase intent. Yet most teams evaluate their creative in isolation, comparing this quarter’s work against last quarter’s, without ever asking the obvious question: how does our creative perform relative to the rest of the category?
The reason is straightforward: until recently, the data didn’t exist. Competitive benchmarking for creative required the kind of normative database that only legacy research firms could build — and they cost a lot. A single benchmarking study from a traditional research house could cost $50,000 or more, take six to eight weeks, and deliver results too late to change the creative that was already in market.
That’s changed. Pre-launch creative benchmarking is now accessible to any marketing team, and the organizations that adopt it are making sharper creative decisions with significantly less waste. This guide walks through what competitive benchmarking for creative actually means, how to build it into your process, and why it should be a standard practice in every marketing organization.
What Is Competitive Benchmarking for Creative?
The Difference Between Performance Benchmarking and Creative Benchmarking
Most marketers are familiar with performance benchmarking — comparing your campaign metrics (CTR, CPA, ROAS) against category averages published by platforms or industry reports. This is useful for evaluating whether your media buying is efficient, but it tells you nothing about whether your creative is effective.
Creative benchmarking is a fundamentally different exercise. It measures how well your creative persuades relative to other creative in your category, using metrics like persuasion lift, consideration shift, and purchase intent change. The question isn't 'did people click?' It's 'did our creative change minds — and does it change more minds than our competitors' creative?'
This distinction matters because a campaign can be operationally efficient (low CPA, decent CTR) while being strategically ineffective (zero measurable shift in brand perception or purchase intent). Performance benchmarks can't catch that gap. Creative benchmarks can.
Why Industry Benchmarks for Digital Marketing Fall Short
When marketers search for industry benchmarks, they typically find platform-reported averages: average CTR by vertical from Google Ads, average engagement rates by industry from Meta, average video completion rates on YouTube. These numbers are widely published and easy to access.
The problem is that these are channel metrics, not creative effectiveness metrics. They tell you what’s normal for a platform, not what’s normal for creative persuasion in your category. A 1.2% CTR might be above the industry average for display ads, but that number says nothing about whether your message is actually shifting brand consideration relative to what competitors are doing.
True creative benchmarks require a different data source: aggregated results from controlled experiments that measure persuasion across many brands in a category. That kind of normative
How to Benchmark Creative: A Step-by-Step Framework
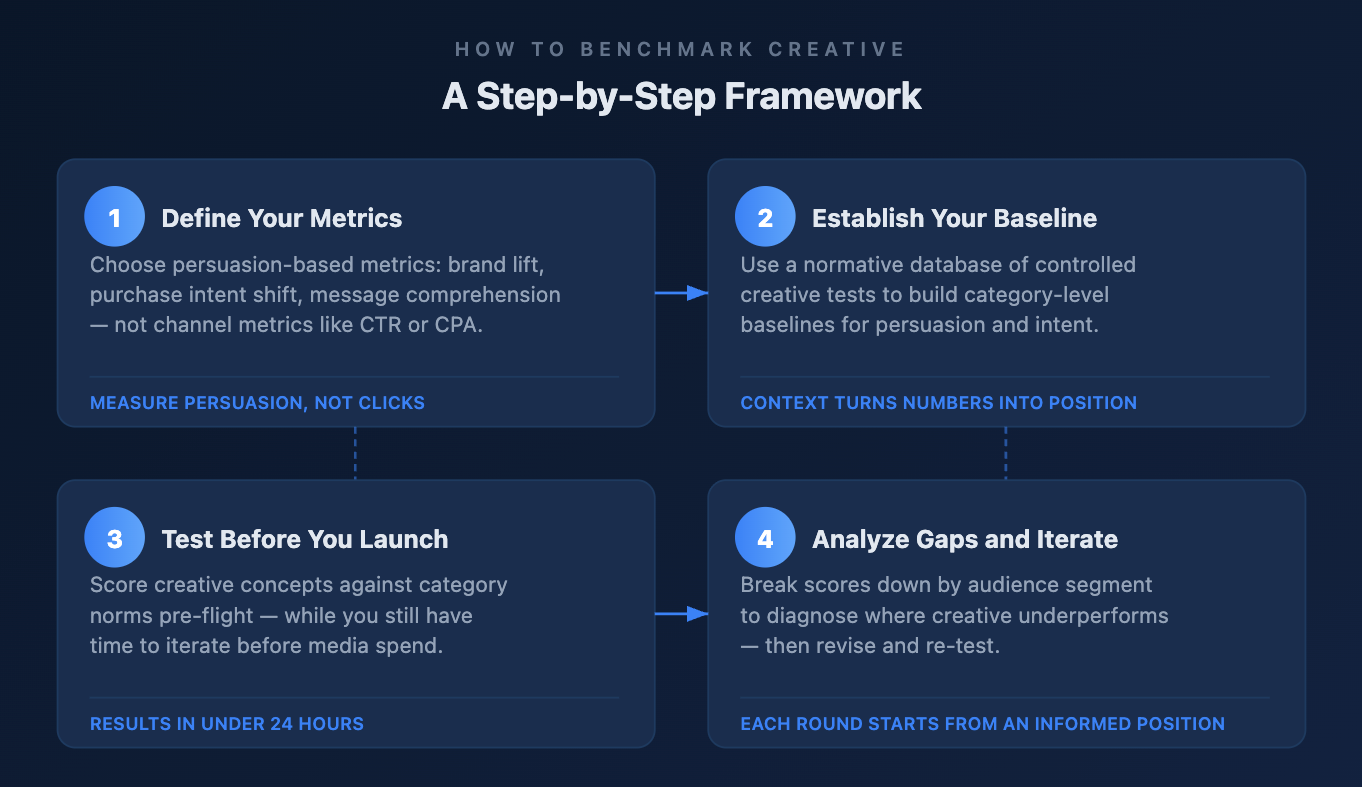
Step 1: Define What Marketing Metrics You’re Measuring
Persuasion Lift vs. Engagement Metrics
Before you can benchmark, you need to choose what you're benchmarking. If you're comparing click-through rates against industry averages, you're doing performance benchmarking. That's a legitimate exercise, but it won't tell you whether your creative is persuasive.
For creative benchmarking, the metrics that matter are persuasion-based:
- Brand lift: the measured change in awareness, consideration, or favorability caused by exposure to your creative
- Purchase intent shift: the change in stated likelihood to buy
- Message comprehension: whether the intended takeaway actually landed
These are measured through experimental methods — typically randomized controlled trials — not ad server logs.
Step 2: Establish Your Category Baseline
How to Find Industry Benchmarks That Actually Matter
The benchmarks worth having aren’t published on Google’s help center. They come from normative databases built by companies that run large volumes of controlled creative tests across categories, aggregating the results into category-level baselines for persuasion, consideration, and intent.
For example, a normative database might show that the median brand lift score for a 30-second CPG ad is 4.2 percentage points on consideration, while the top quartile starts at 7.1 points. That context transforms an abstract result into a competitive position: if your ad scored 5.8 points, you’re above the median but below the top performers. You know where you stand and how far you need to go.
Without that baseline, a 5.8-point lift is just a number on a slide. With it, you have a strategic diagnostic.
Step 3: Test Your Creative Against the Baseline
Pre-Flight Scoring: Know Before You Spend
The most valuable time to benchmark is before launch, when you can still change the creative. Pre-flight scoring means testing your concepts against category norms before committing media dollars.
This flips the traditional measurement model. Instead of launching a campaign, measuring results after it ends, and hoping to apply lessons next quarter, pre-flight scoring gives you a competitive read while you still have time to iterate. A concept that scores in the bottom quartile of your category can be revised or replaced before a single impression is served.
The speed of modern testing tools makes this practical. What used to require a six-to-eight-week research engagement can now be completed in under 24 hours, with statistically reliable results from randomized controlled trials. The excuse that “there isn’t time to test” no longer holds.
Step 4: Analyze Gaps and Iterate
When your creative scores below the category benchmark, the diagnostic question isn’t “is this ad bad?” It’s “where specifically is it underperforming?” A below-benchmark score on persuasion lift could indicate a message framing problem, an audience mismatch, a format issue, or a competitive positioning gap.
Breaking the benchmark down by audience segment often reveals the most actionable insight. An ad might score at the 60th percentile overall but at the 30th percentile among your highest-value segment. That’s a targeting and messaging problem that benchmarking makes visible — and that in-market performance data alone would never surface.
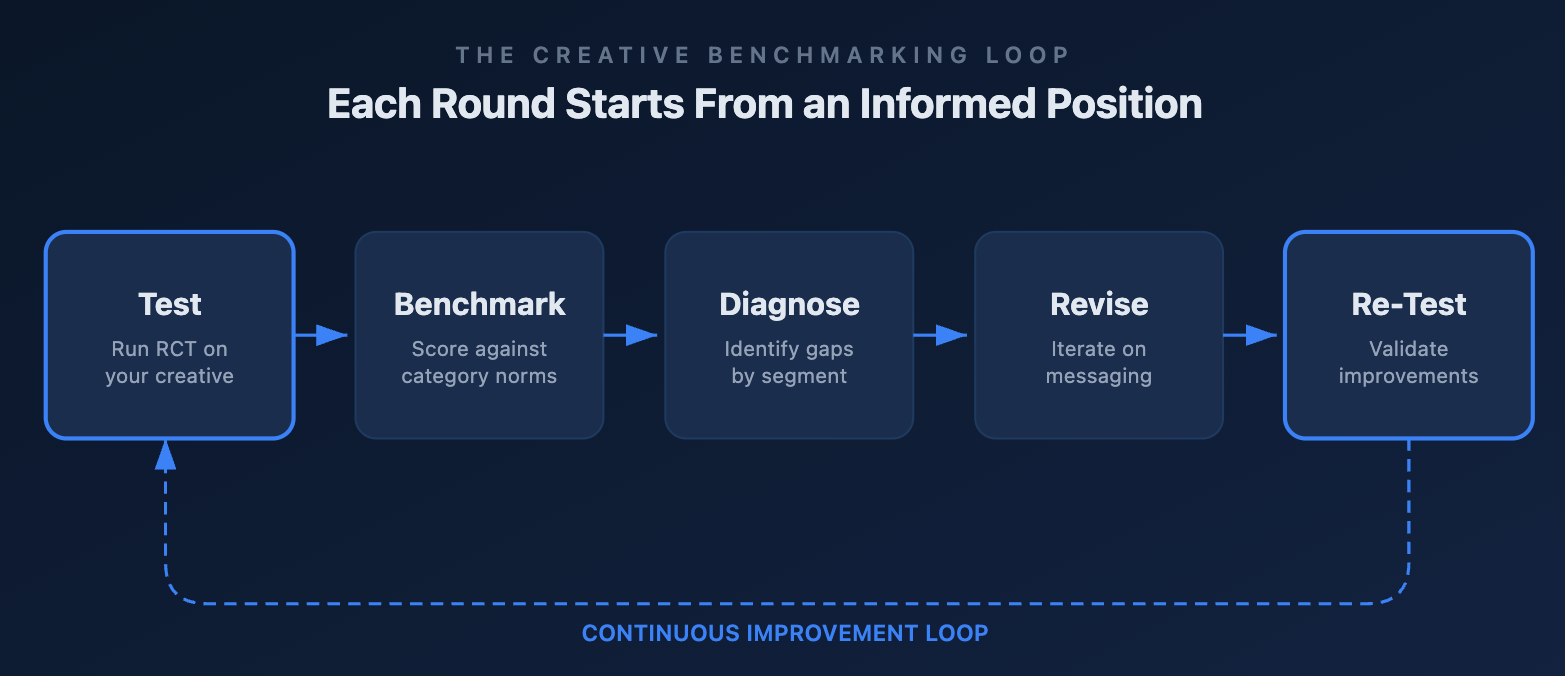
The iterative loop is straightforward: test, benchmark, diagnose, revise, re-test. Teams that build this into their creative development process consistently produce stronger work over time, because each round starts from an informed position rather than from zero.
What Competitive Creative Benchmarking Looks Like in Practice
Example: Scoring a Marketing Campaign Against Category Norms
Consider a mid-size DTC brand preparing to launch a new campaign across paid social and CTV. Before committing their $2M media budget, they test three creative concepts against category norms using a pre-flight benchmarking tool.
- Concept A scores at the 72nd percentile for persuasion lift — above the median, strong enough to run with confidence.
- Concept B scores at the 45th percentile — below average, flagging a message framing issue.
- Concept C scores at the 38th percentile — underperforming across every audience segment.
Without benchmarking, the team would have relied on internal consensus ('I like Concept B') or past performance proxies ('This format worked last time'). With benchmarking, the decision is data-driven: run Concept A, revise Concept B's framing and re-test, shelve Concept C. The entire process — testing, benchmarking, iteration — was completed in under a week.
Why Pre-Launch Benchmarking Changes the Game
From Post-Mortem to Pre-Flight
The traditional creative measurement model is a post-mortem: launch the campaign, wait for it to end, run a brand lift study, and discover three months later that the creative underperformed. By then, the budget is spent and the team has already moved on to the next brief.
Pre-launch benchmarking reverses this. It puts competitive context at the point where it has the most leverage: before media investment. This has three compounding effects:
- Reduces waste by preventing underperforming creative from ever reaching market
- Strengthens the creative process by giving teams a measurable standard to aim for
- Builds organizational confidence in creative decisions, replacing subjective debate with evidence
How ViewShift Index Makes This Possible
ViewShift Index is built on a normative database of thousands of pre-launch creative tests across categories and audiences. When you test your creative through ViewShift, you don’t just get a persuasion score — you get that score in the context of your category: where you rank, what the top performers look like, and where the gaps are.
This is the kind of competitive benchmarking infrastructure that used to be available only to the largest advertisers working with legacy research firms. It’s now accessible to any team, at any budget level, with results delivered in under 24 hours. >> Learn More.
Frequently Asked Questions About Creative Benchmarking
What is competitive benchmarking in marketing?
Competitive benchmarking in marketing is the process of measuring your brand's performance against competitors or category norms. For creative specifically, it means measuring how well your ads shift brand consideration and purchase intent relative to other creative in your category — using controlled experiments, not platform metrics.
How do I find industry benchmarks for digital marketing?
Platform-reported averages (Google Ads CTR benchmarks, Meta engagement rates) are widely available but only measure channel efficiency. For creative effectiveness benchmarks, you need a normative database — aggregated results from controlled creative tests across your category. These are provided by specialized research platforms, not ad platforms.
What is the difference between performance benchmarking and creative benchmarking?
Performance benchmarking compares operational metrics like CTR, CPA, and ROAS against category averages. Creative benchmarking measures persuasion — how much your creative shifts brand consideration, purchase intent, and awareness relative to competitors. A campaign can be operationally efficient and creatively ineffective at the same time.
How do you do industry benchmarking for creative?
The process has four steps: (1) Define persuasion-based metrics — brand lift, purchase intent shift, message comprehension. (2) Establish a category baseline using a normative database of controlled creative tests. (3) Test your creative against that baseline before launch. (4) Diagnose gaps by audience segment and iterate. Modern tools deliver results in under 24 hours.
When is the best time to benchmark creative?
Pre-launch — before committing media budget. Testing creative after a campaign ends tells you what happened but doesn't give you time to change anything. Pre-flight scoring lets you compare creative concepts against category norms while you can still revise or replace them.
How much does competitive creative benchmarking cost?
Legacy research firms charged $50,000 or more for a single benchmarking study, with a six-to-eight-week timeline. Modern pre-launch creative benchmarking platforms have made this accessible at significantly lower cost, with results delivered in under 24 hours.
Key Takeaways
Creative benchmarking is no longer optional for teams that take campaign performance seriously. The data now exists to score your creative against category norms before you spend on media. Performance benchmarks (CTR, CPA) tell you about channel efficiency; creative benchmarks tell you about persuasion effectiveness — a fundamentally different and more strategic measure. The highest-leverage moment to benchmark is pre-launch, when you still have time to iterate. Teams that build benchmarking into their creative development process make better decisions, waste less budget, and build a compounding advantage over competitors who are still guessing.
See how your creative scores against your category — before a dollar goes to media. Request a ViewShift Index demo →